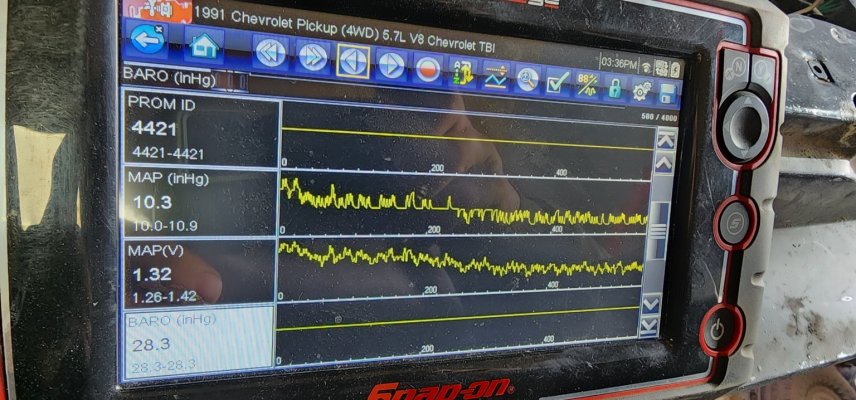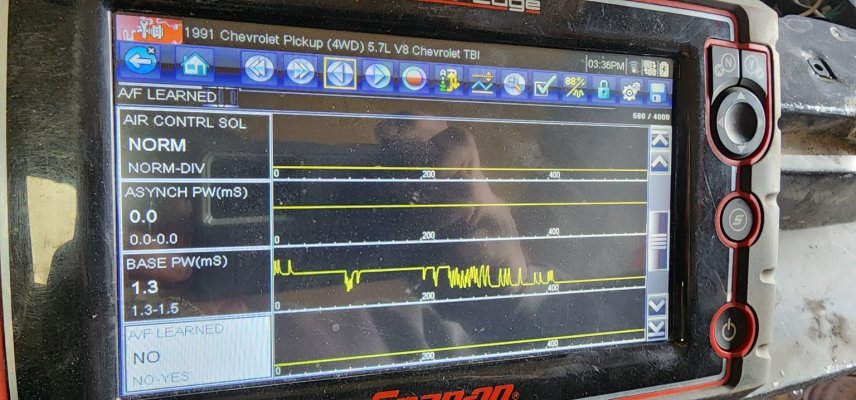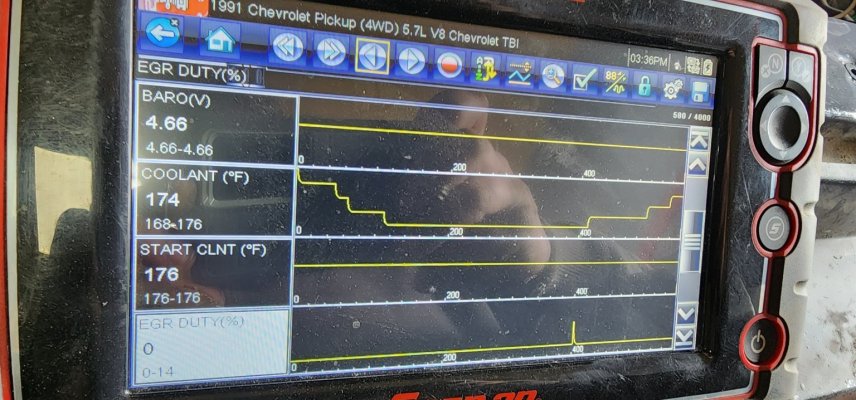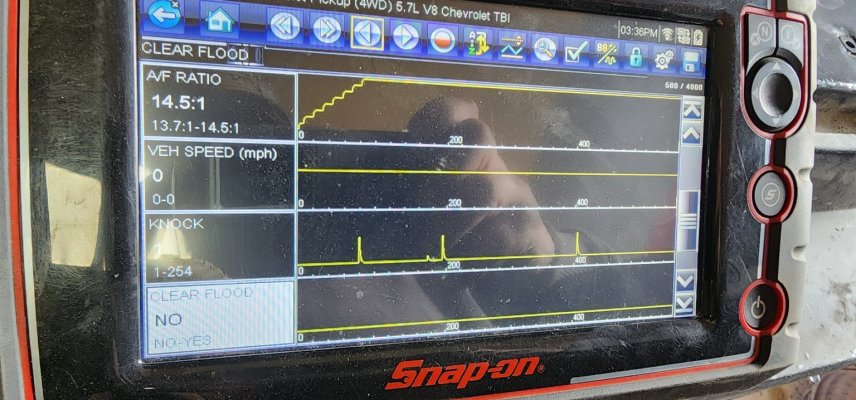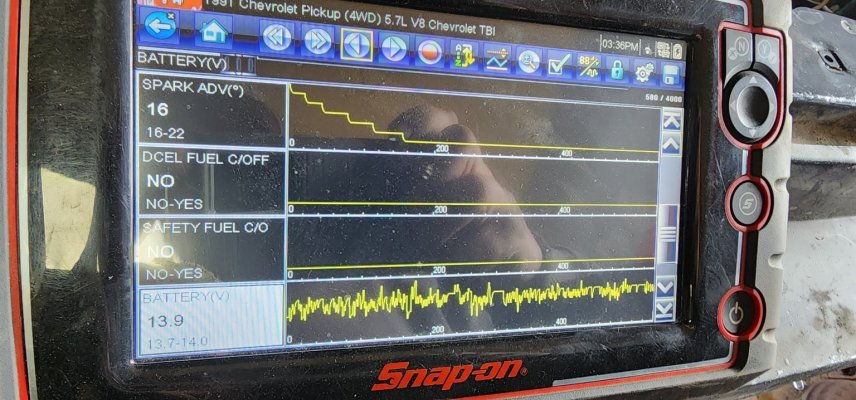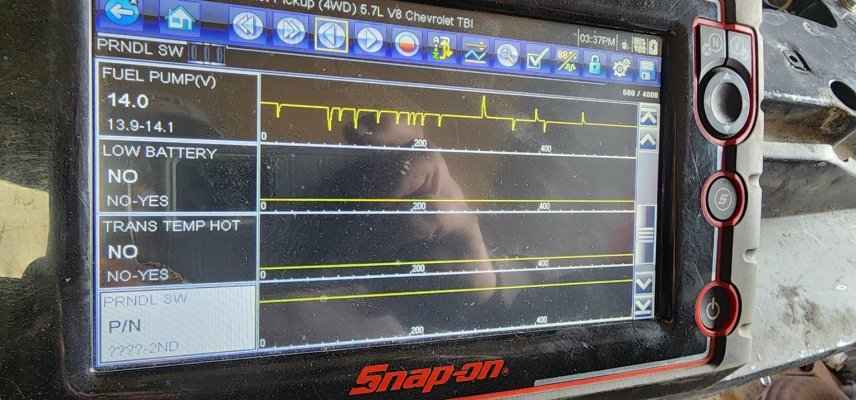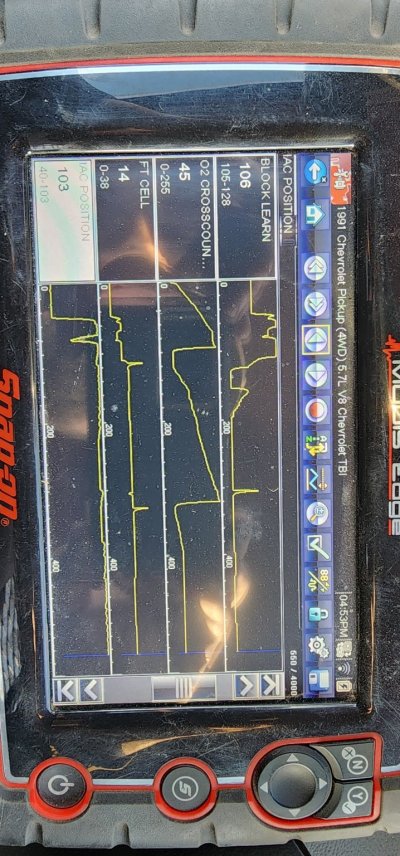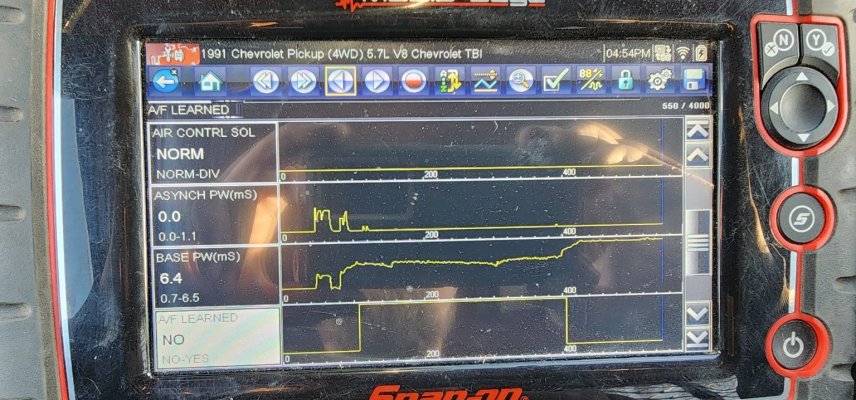

It's not uncommon to see knock cnts here and there be it communication artifacts or real knocks. What's important is if you are consistently seeing knock cnts and/or they are increasing - i.e. enough to change spark advance. You need to monitor multiple PID's under various conditions to make sense of it. See attached example
Hello JDGMC,
Not to derail the thread, but I'm on the cusp of investing in a live data capable setup, so that
I can both up my troubleshooting game as well as getting to sit at the GMT400 cool kids table. :0)
Seriously, what setup are you running that created this chart? Lots of virtual gauges are OK, but
I'm much more interested in the relationships between the signals of interest? I've been raised on
graphical data, and they simply work best for me.
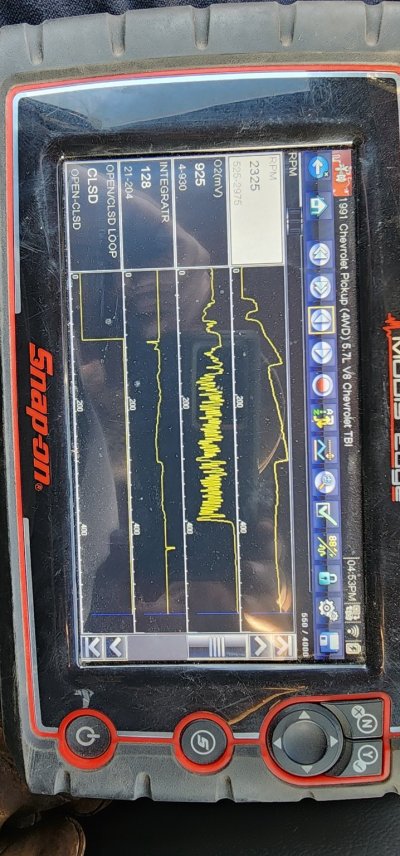
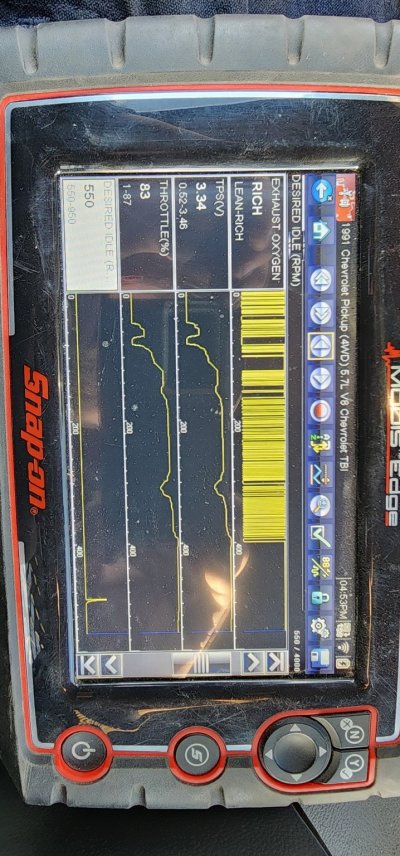
You must be registered for see images attach
(credit: JDGMC's graph in reply #30 with my question added in orange?
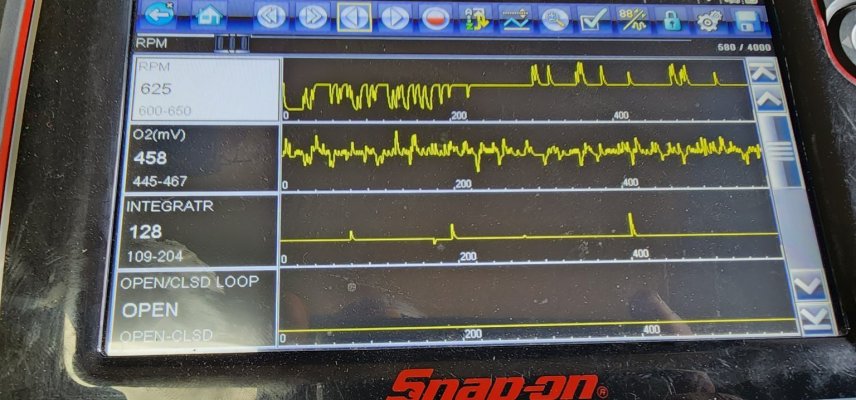
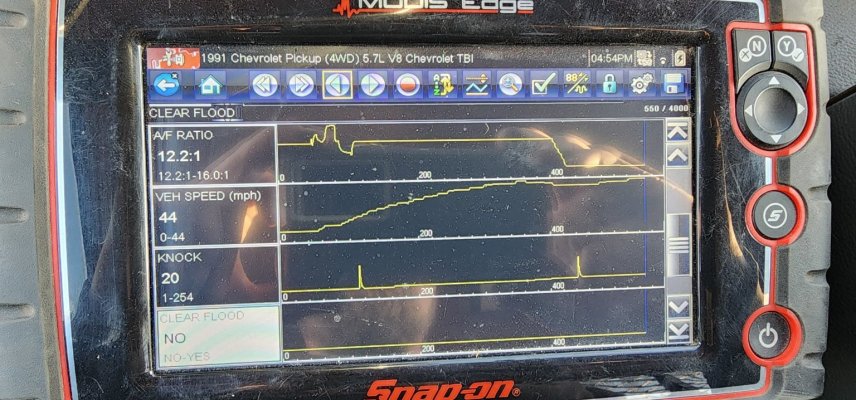
By the way, there's so much to observe here. To me it looks like you can have Knock Count activity
before we go closed loop (as evidenced by the O2 sensors starting to switch) ...but it doesn't
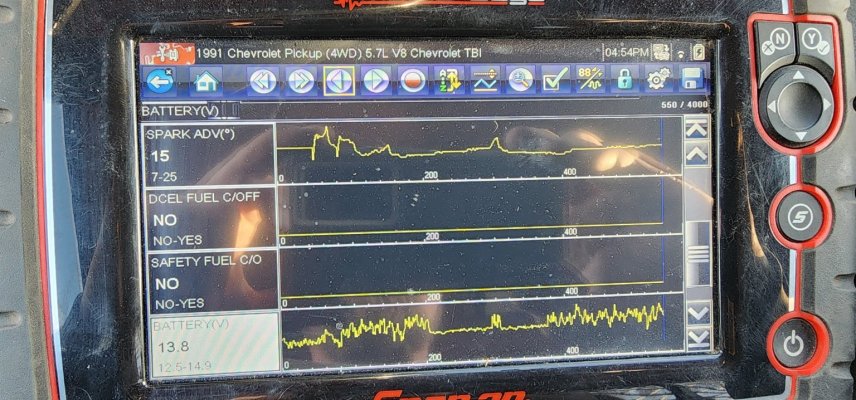
seem to affect the timing? On the other hand, right around the '228 second' mark there is some
Knock Count activity, and above I see a sudden decrease in spark advance?
Also, you can watch the O2 switching frequencies change (slow down) at the warm idle, but speed
right up once you start driving? Anyway, this data graphing display looks to be a winner, so I'm
interested in what you are running.
Thanks in advance!
Last edited: